
Applications of IR Spectroscopy – Mid-IR Region
The mid-IR region is the band of the infrared spectrum, roughly 4000 to 200 cm⁻¹ and containing the 1500-500 cm⁻¹ fingerprint region, that is used for qualitative material identification, reaction monitoring, quantitative estimation, and surface characterization based on molecules’ vibrational absorption bands.
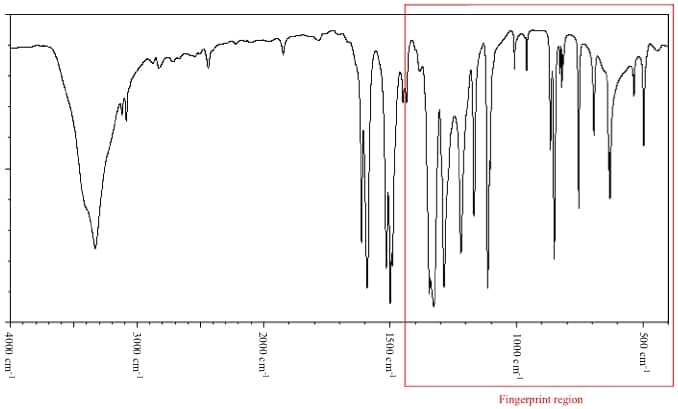
Mid -IR and Finger print regions of the IR spectrum (Image Courtesy : http://www.chem.ucla.edu/)
The infrared region of the spectrum extends beyond the red end of the visible region to the microwave region of the electromagnetic spectrum .Based on applications it is divided into three different regions
| Near IR | 12,500 to 4,000 cm -1 | | --- | --- | | Mid IR | 4000 to 200 cm -1 | | Far IR | 200 to 10 cm -1 |
The mid-IR region is used extensively for qualitative identification purpose and is associated with vibrational transitions in the molecule. The region from 1500 to 500 cm-1 is specifically referred to as the fingerprint region. This region contains a series of very complicated and closely spaced absorption bands arising out of bending vibrations of molecules. Like the fingerprint is characteristic of an individual the spectra in the fingerprint region is characteristic of an individual molecule.. It is unique to each and every molecule which shows active absorption in the region.
It is important to bear in mind that absorbance of infrared energy is possible only under the following conditions:
- Presence of a hetero atom(s) in the molecule
- Change of dipole moment on absorption of infrared energy
- Change in vibration or rotational frequencies of the entire molecule or at least a part of the molecule.
Application Areas
Material Characterization
IR spectroscopy is a popular qualitative identification technique which uses comparison of the spectra of unknown sample with the spectra of known standard materials. Such spectra can be manually overlaid for peak to peak comparisons. However, on FT-IR systems search libraries are available on software and can be overlaid on spectra for comparison purpose. It takes only a fraction of time compared to what it it used to take in earlier days. Further it is possible to quantify the match using software in terms of correlation factors.
Reaction Monitoring
The appearance or disappearance of a characteristic band over a period of time can be related to the progress of a reaction such as oxidation- reduction . FTIR applications provide real-time monitoring of reactions in process streams.
Quantitative Estimations
Earlier dispersive IR techniques suffered from limitations restricting quantitative estimations such as non-availability of matched pair of cells, absorbance interference of commonly available solvents and air contaminants. However, with the advent of FTIR technology and its accompanying advantages more and more quantitative estimations were possible.
Surface Characterization
Adaptation of microscopic technique to IR spectroscopy resulted in commercialization of the FTIR microscope. This contributed immensely to scan of a specimen surface for in homogeneities in terms of chemical composition. Clinical applications developed later for compositional studies on gallstones and urinary stones.
In this article the general applications were briefly covered for the mid-IR region .Another article will deal with near and far IR region applications.