
calculation of System Suitability in Chromatography
System suitability testing (SST) is the set of checks performed on a chromatographic system — including resolution, peak asymmetry, precision, signal-to-noise ratio, theoretical plates, and retention factor — used to confirm the system meets defined acceptance limits before samples are analyzed.
How to calculate System Suitability in Chromatography
High-Performance Liquid Chromatography (HPLC) technique is applied in various places to separate out a mixture’s components. Through this process, the liquid’s effectiveness is examined by passing it over an absorbent material.
One of the major applications of this technique is in the pharmaceutical industry, where experts research and test different components. System suitability testing is a part of this procedure.
In my earlier post on generation of authentic chromatographic data I had emphasized the need for evaluation of system suitability before proceeding with analysis. Some factors contributing to system suitability failures in HPLC were discussed. The current post introduces you to system suitability parameters and their acceptance limits.
But let’s first understand the concept of system suitability testing.
System Suitability Test (SST)
This testing is used for examining a liquid chromatographic system’s specs. That is why it is crucial to opt only for an appropriate method for the calculations. On the other hand, an acceptance criterion is also set, called the SST limits. It is vital to meet these limits before analyzing any sample for your purpose.
Now, let’s move on to the parameters that have to be checked under this testing.
Resolution
The resolution in HPLC is a measure of the quality of separation between two chromatographic peaks. It plays a crucial role in checking the feasibility of this critical separation according to the given circumstances.
Well resolved peaks are basic requirement in both qualitative and quantitative estimations. Separation between closely spaced peaks is governed by affinity for the stationary phase.
Co-eluting compounds can be resolved by:
- Change of mobile phase polarity
- Increase of column length
- Reducing particle size of stationary phase
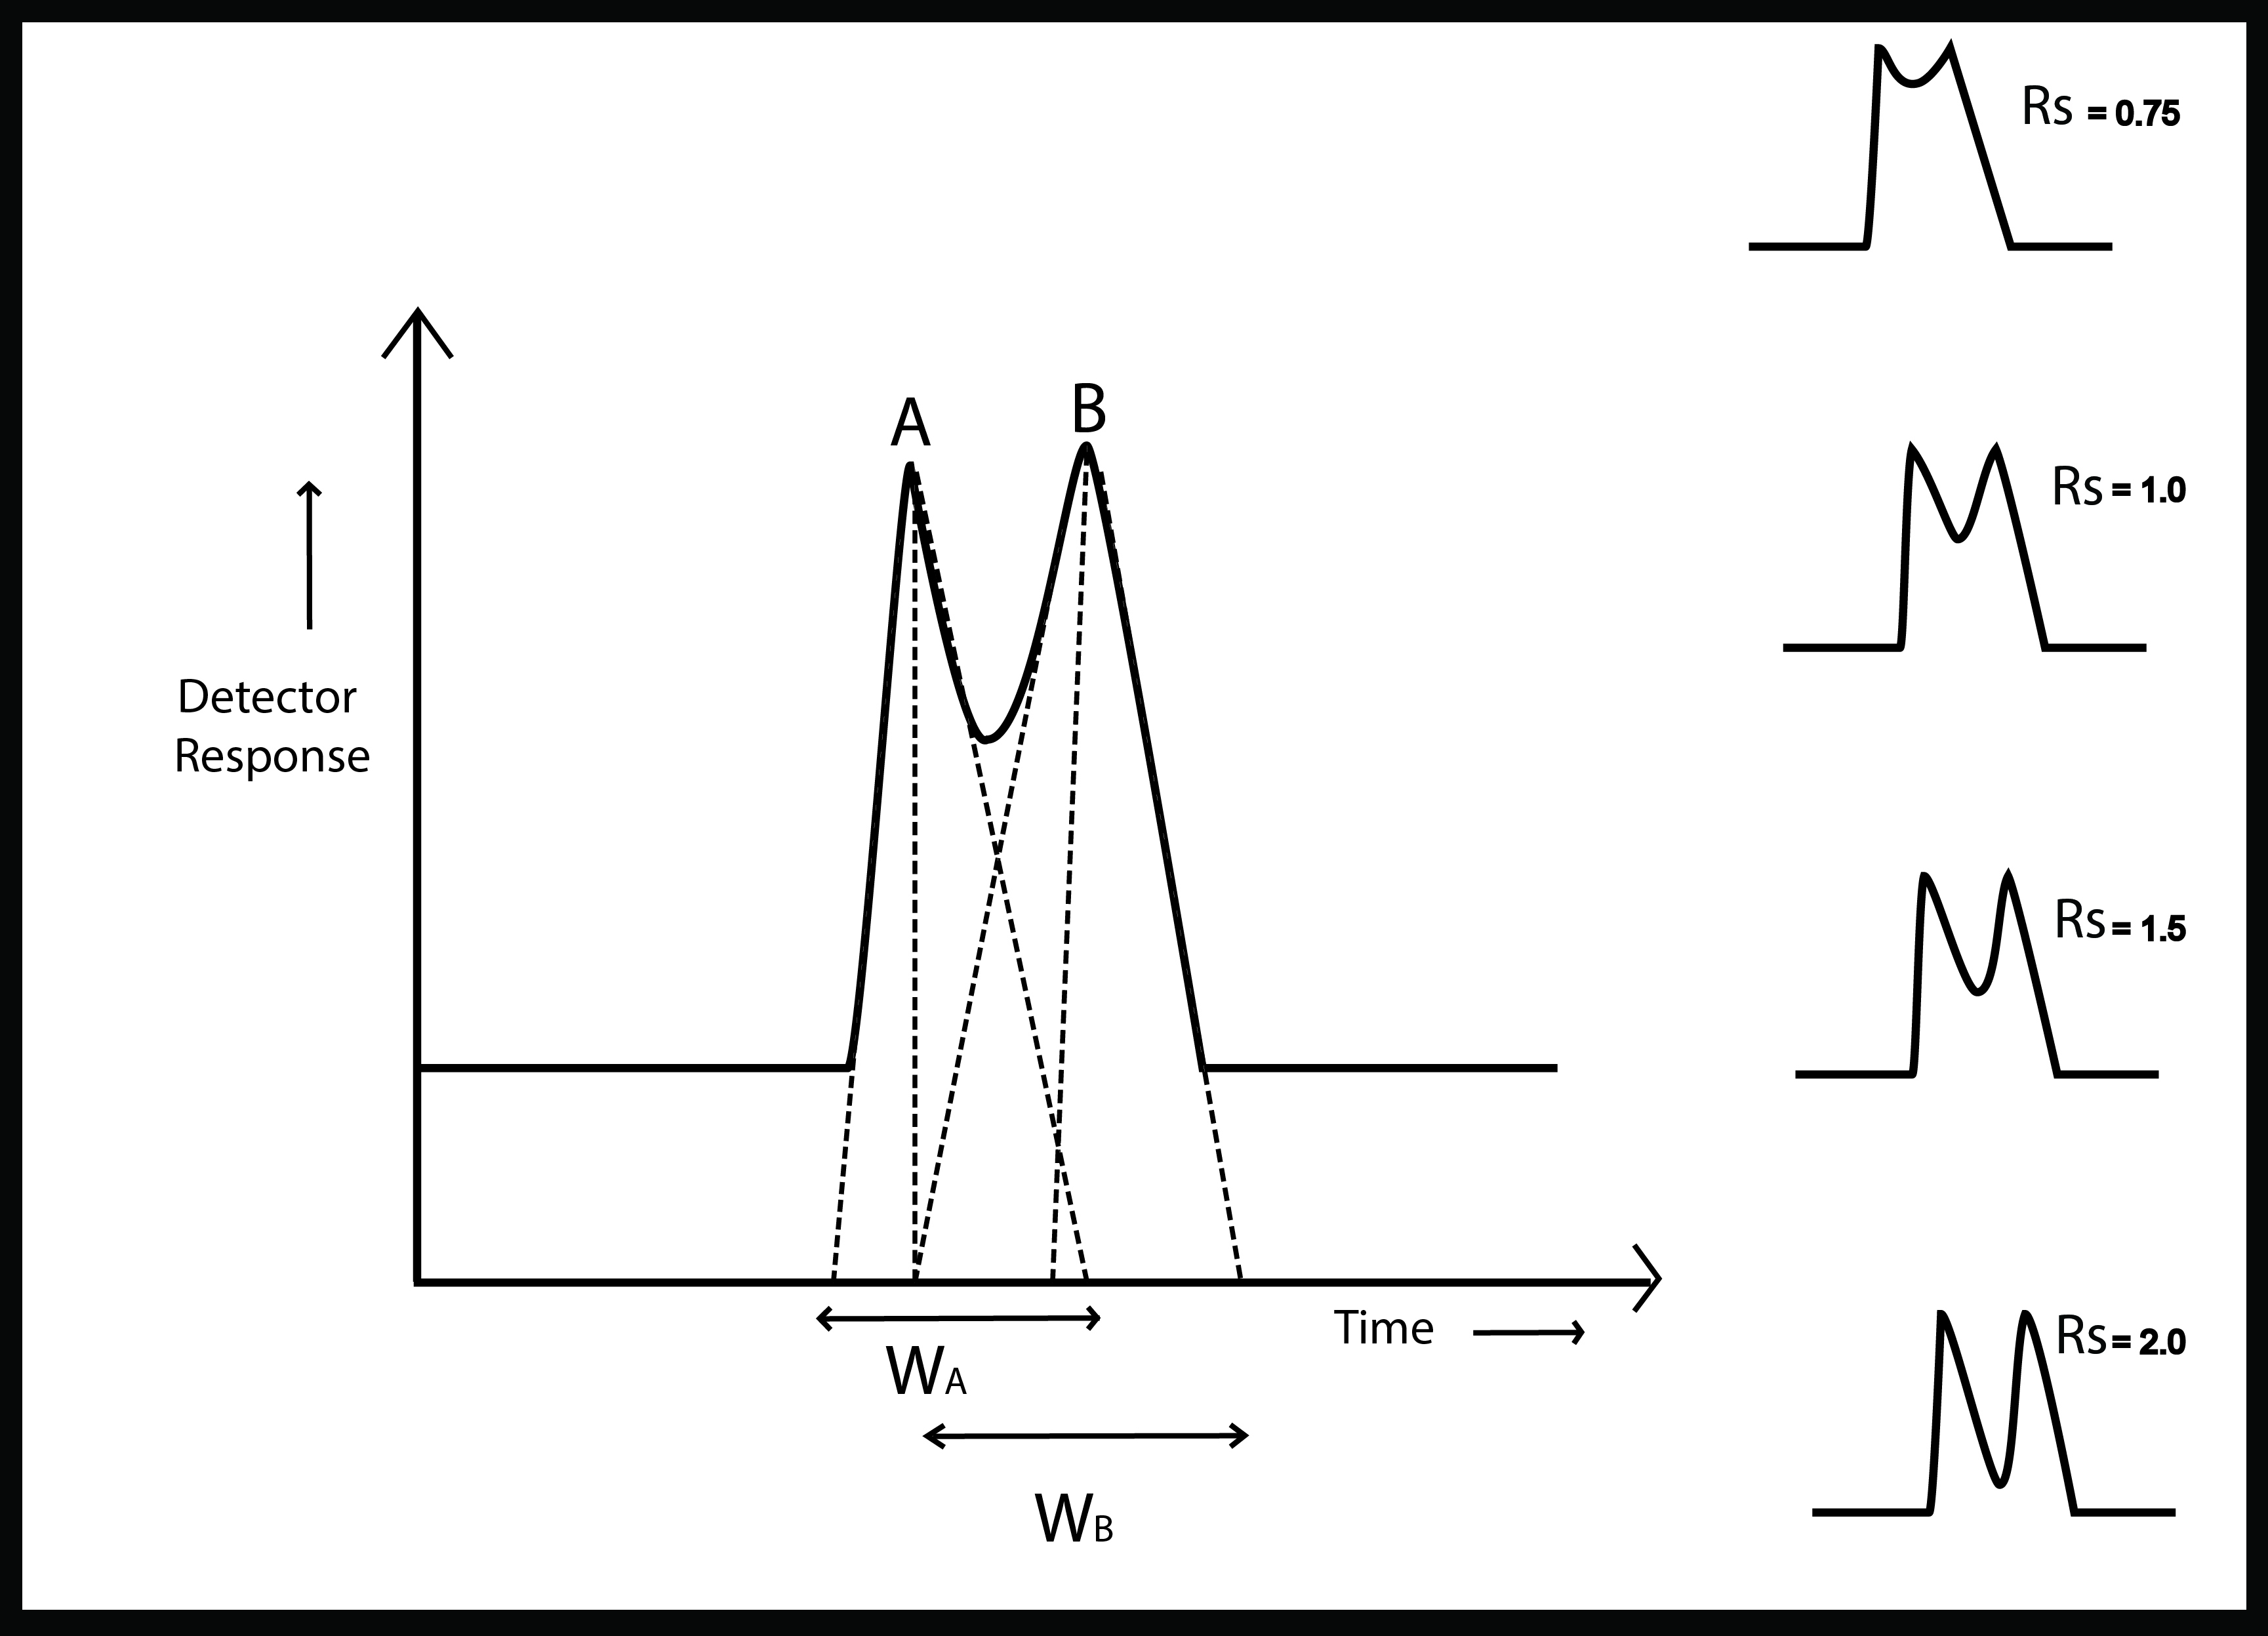
Resolution of Chromatographic Peaks
R_S=(tR_B - tR_A)/(0.5 (W_A + W_B) )
Where tR_B and tR_A are retention times of peaks A and B
Peak widths W_A and W_B are obtained from the intersection of tangents with baseline
Almost all peaks show a bit degree of tailing. That is why the resolution is considered complete only if it equals or exceeds 1.5. Another important factor to consider here is that the equation can not be used if the peaks are not resolved at the level of baseline. But this is not something to worry about because it is virtually impossible for the peaks to overlap at the bottom. Even the peak baseline width measurement is not feasible.
In all other cases, this resolution formula in chromatography provides a much efficient outcome.
Resolution is considered complete if it equals or exceeds 1.5
Enter values above to see your result.
Asymmetry or Tailing factor (Aₛ)
An ideal chromatographic peak should be of symmetrical Gaussian shape but due to various factors the shape often deviates. Peak tailing is the commonly observed peak deformation. It is mainly due to occurence of more than one mechanism of analyte retention. Tailing can be reduced by changing mobile phase pH or end-capping of stationary phase.
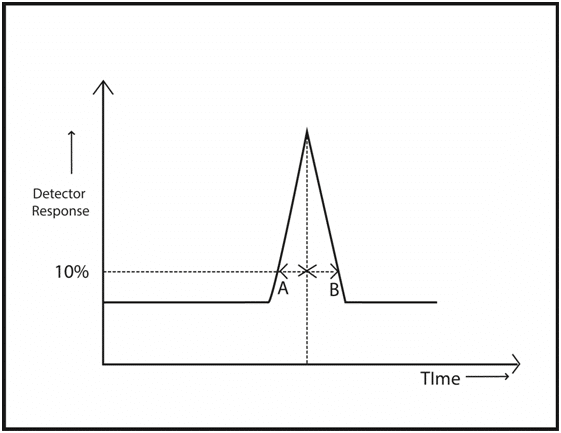
Assymetry factor
where A and B are peak widths at 10% of the height for leading and tailing ends of the peak
Ideal peak has As =1 but values in the range 0.9 – 1.1 are acceptable
Tailing becomes apparent when asymmetry factor As equals to or exceeds 1.2
As per USP definition the tailing is considered as the ratio of the widths a and b at 5% of peak height and the tailing factor formula is expressed as
T = (a+b)/(2a)
T should be less than or equal to 2 to satisfy the system suitability requirement.
Enter values above to see your result.
The tailing factor in HPLC is also known as the symmetry factor.
Precision
Replicate injections of a standard preparation are used to ascertain if requirements of precision are met. This is used to demonstrate the system performance when it gets exposed to some specified column usage, environment, and plumbing conditions.
Data from five replicate injections are used if requirement of relative standard deviation is less than 2%. Data from six replicate injections are used if the requirement of relative standard deviation is more than 2%.
Signal To Noise Ratio (S/N)
This parameter is used for the lower-end calculation of the performance of the system.
Noise: It is measured between two specific lines that bracket the baseline.
Signal: It is measured starting from the baseline’s middle and ending to the peak’s top.
Once calculating both these factors, the ratio can be measured by dividing the signal value by the noise value. With this, generally, the noise value has to be reduced using one of the following methods:
- Signal Averaging
- Reagent and Solvent Purity
- Column Flushing and Sample Clean-Up
- Temperature Control
- Additional Pulse Damping and Mixing
Theoretical Plates: Column Efficiency
The plate theory concept assumes that the chromatographic column comprises a large number of imaginary separation layers called theoretical plates. Equilibrium of the sample takes place between the stationary and the mobile phase in these imaginary plates. The analyte moves down the column by transfer of equilibriated mobile phase from one plate to the next.
Column efficiency is expressed in terms of theoretical plates(N).High resolution means greater number of plates in a given length of column. That is why it is always preferred to keep the plate number high for any provided column. The number of plates can be calculated by:
N =16([((t_R))/(W))]² Where W is the peak at base
or
N = 5.54([((t_R))/(W(1)/(2)))]²
Where W_1/2 is peak width at half height where
t_R is retention time and W_1/2 is the peak width at half height
It is recommended that Theoretical plates should not fall below 2000
The benefit of opting for this method is that the number of theoretical plates can be calculated even if the resolution is poor, and the two consecutive peaks are not entirely differentiable. It becomes possible due to the use of half-height in the formula. However, the valley that lies between these peaks must be lower than their half-heights. Only then can the number be calculated.
The method is not much utilized in the manual calculations. Instead, it is mostly preferred for automatic verifications done on data systems. In the case of calculating the theoretical plate number, the following formula can be used:
Plate per meter = Number of theoretical plates in one column x 100 /HPLC column length in cm
A USP method for theoretical plate calculation can be used for other cases.
Retention factor (k’)
Retention factor (k’) or partition ratio or capacity factor is the relation of time spent by a compound in stationary phase to the time it spends in the mobile phase. This is one of those parameters that can be identified without any hassle.
k’ is a unitless quantity
k’ = (t_r - tₘ)/(tₘ)
Higher the value of k’ greater is the retention of a compound on a column
Ideally k’ should be greater than 2.0
You can easily calculate all the factors using these equations. However, you must remember that the final results can show extreme deflections based on the type of analysis you are performing and the analytical conditions around it. Plus, these tests are not only done at the beginning. You need to conduct them periodically to ensure that the system performance remains intact. The values may change with time because of the continuous use of the system.