
chromatographic calculations
Peak height and peak area are the two measurements chromatography software can use to quantify a component from its chromatographic peak; area is generally the more reliable choice because, unlike height, it stays accurate even when peaks are distorted by tailing, fronting, or baseline noise.
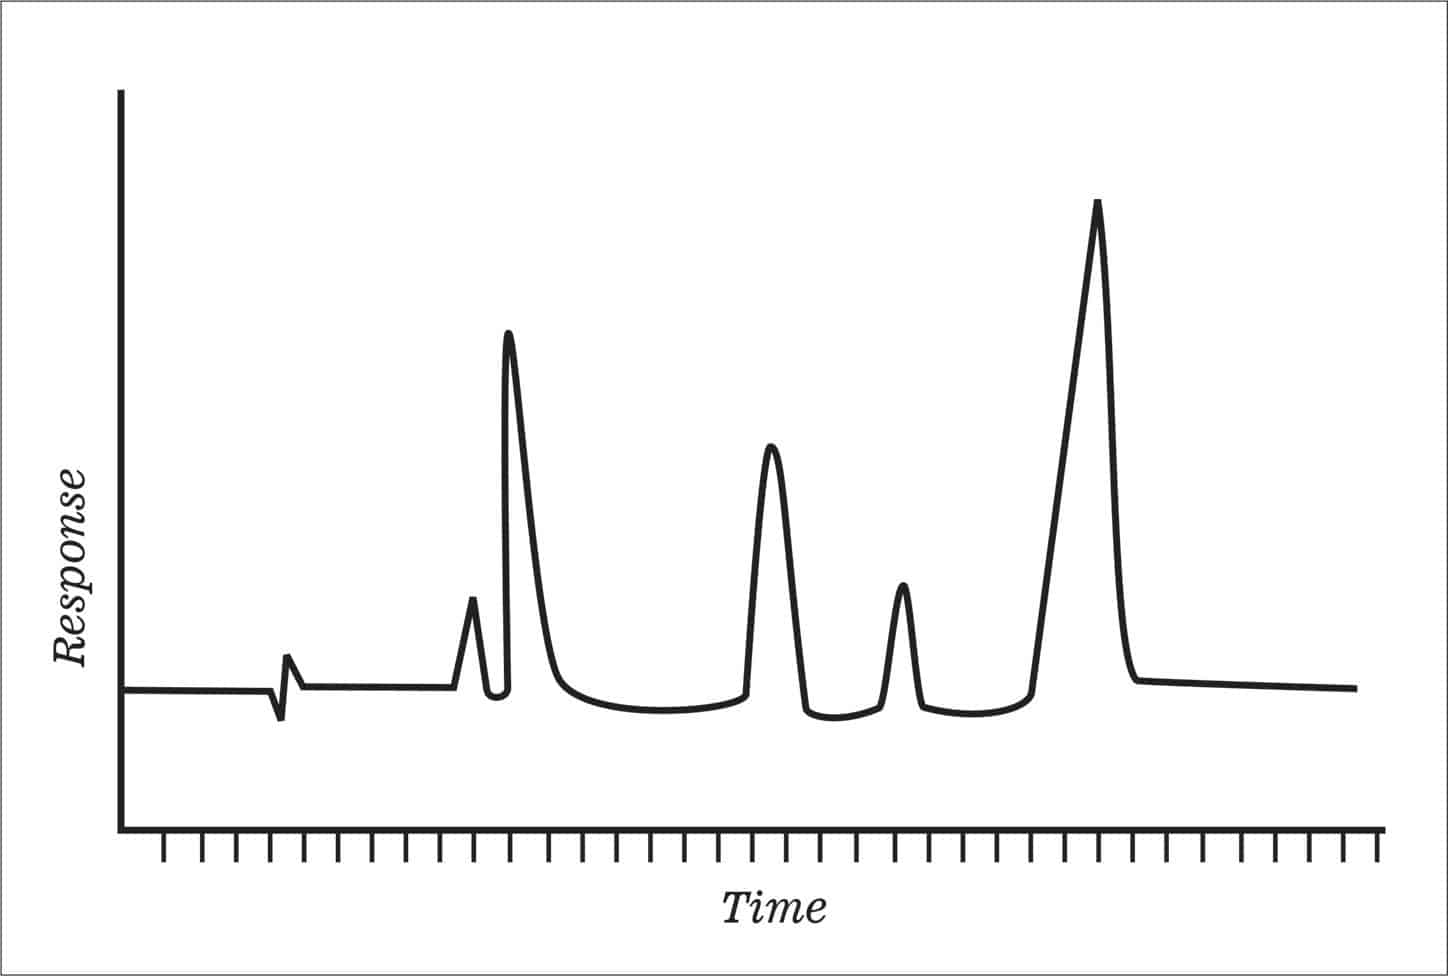
Ideal Chromatographic Peaks
The chromatogram shown above is an ideal one showing symmetrical shaped peaks rising above a stable horizontal baseline. It can be seen that the peaks are well separated from one another and there are no overlap or shoulder bands. In such situations it is immaterial whether you use peak height or peak area in quantitative calculations.
Real-life sample chromatograms may not be that simple and will more than often show deviations resulting in non-Gaussian peaks due to several factors some of which are listed below:
- Presence of interfering compounds or impurities in the sample mixture
- Changes in operational parameters such as column temperature, flow rate of carrier stream, injection volume, etc.
- Leakages due to septum coring or worn out ferrules, O-rings or joint fittings.
- Detector response variation due to nature of compound
- Residual impurities present from earlier analysis.
Due to such reasons the chromatograms can deviate from ideal peak shapes and distortions in chromatograms become apparent as shown below
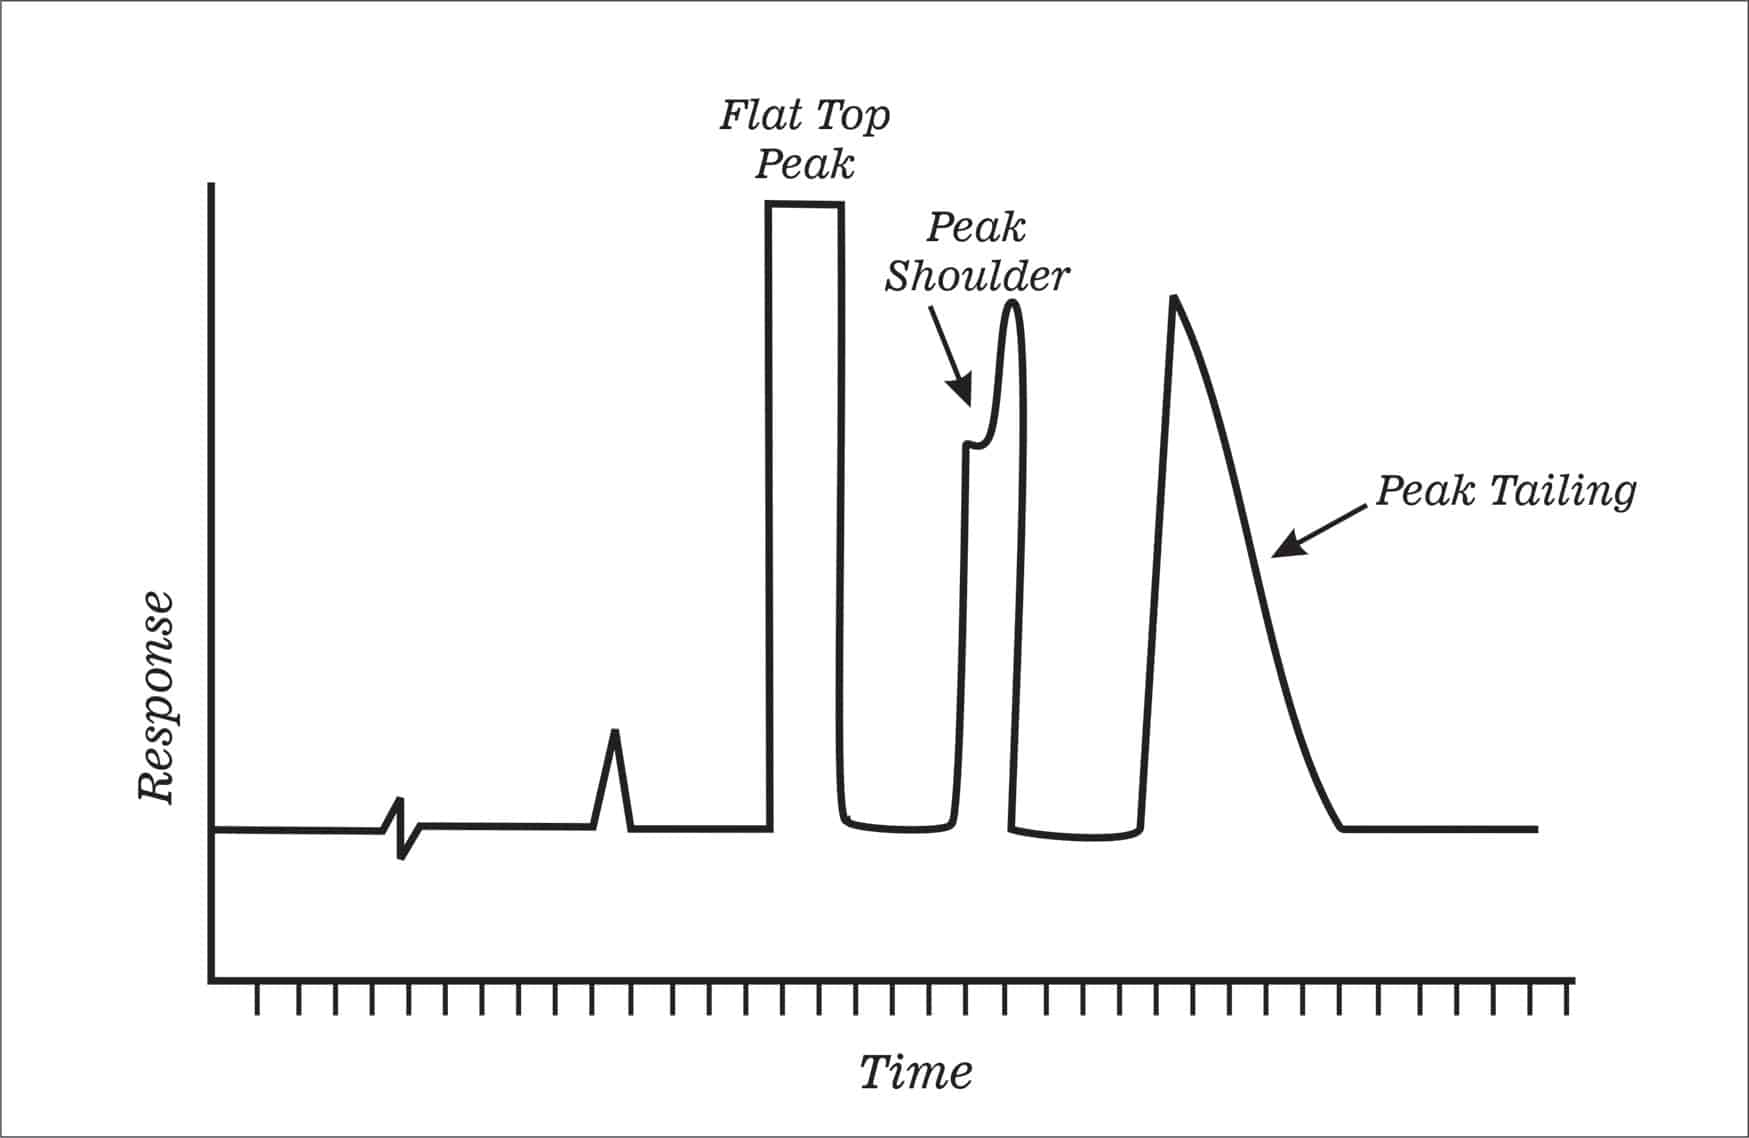
Distorted Chromatographic Peaks
In such cases complications arise due to unsymmetrical peak responses and unstable baselines which are not uniformly flat. Peak height based calculations will lead to errors in quantitative estimations. Closely appearing peaks cannot be integrated in a reproducible manner because neighbouring peaks or overlaps influence peak height and area integration.The same is true for peaks arising from sloping or noisy baselines.
Peak integration is a mathematical operation performed by the chromatographic software to measure the area under a peak. The area measurement is based on integration which hypothetically divides the region below the peak into several rectangles which are summed up to give the total area under the peak.
In order to define this area the software permits either manual or automatic marking of the start and end points of the peak. The baseline is then drawn between the start and end points to define the area calculation. It is important that same algorithm is used for area calculation of standard as well as sample peaks
Asymmetrical peaks often result due to peak tailing. It is difficult to reproducibly mark the endpoint of such peaks. This leads to errors in reporting of areas resulting in lowering of precision and accuracy of quantitative measurements.
Peak areas are used for most quantitative chromatographic estimations. Peak heights can vary due to distortion of the shapes such as the broadening or fronting and tailing. However, in such situations areas are not affected and show high reproducibility.
On the other hand for very small peaks resulting from trace amounts of impurities peak height calculations may be a better option as errors in small variations in making start and end point of peaks become negligible.
The answer to the choice is based on your judgement of the quality of the chromatogram. However, in a majority of situations it would be advisable to make use of peak area measurements to get the highest levels of accuracy and precision.
Should I use peak height or peak area for quantitative chromatography?
In most situations, peak area is the better choice because it remains reproducible even when peak shapes are distorted by tailing, fronting, or overlapping bands, whereas peak height calculations can be significantly affected by such distortions.
When is peak height a better choice than peak area?
Peak height can be a better choice for very small peaks resulting from trace-level impurities, where small errors in marking the start and end points for area integration become negligible relative to the peak's overall response.
What causes chromatographic peaks to deviate from an ideal shape?
Deviations from ideal peak shape can result from interfering compounds or impurities in the sample, changes in operating parameters such as column temperature or flow rate, leaks from worn seals or fittings, detector response variations, and residual impurities from earlier analyses.
How does peak integration work in chromatography software?
Peak integration software divides the region beneath a peak into small segments between defined start and end points and sums their areas to calculate the total peak area, using the same algorithm consistently for both standard and sample peaks to ensure comparable results.
Why can peak tailing cause errors in quantitative results?
Peak tailing makes it difficult to mark a peak's endpoint reproducibly, which leads to inconsistent area measurements and reduces the precision and accuracy of quantitative results.