
Beer–Lambert’s Absorbance law
The Beer-Lambert law is the relationship used to calculate an absorbing species’ concentration from its measured absorbance, and real samples deviate from its ideal straight-line behaviour due to chemical factors such as pH-dependent colour changes and instrumental factors such as stray light and monochromator wavelength inefficiencies.
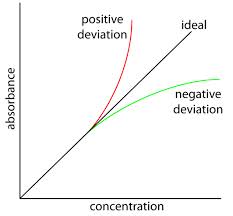
Deviations from Beer- Lambert’s law
Beer–Lambert’s Absorbance law is a universally accepted relationship which helps calculation of concentration of an absorbing species from measured absorbance values. Under ideal conditions absorbance versus concentration plot is a straight line passing through the origin. However, under real situations a curvature in the plot is observed beyond a particular concentration. The curvature can be both positive or negative depending on the nature of absorbing species and experimental conditions. Deviations from the law were discussed in an earlier article. The present article will discuss the reasons responsible for such deviations.
Positive deviations are observed when the measured absorbance values are more than the expected theoretical values and negative deviations result when the measured values are lower than the theoretical values.
Limitations of the Law
Beer – Lambert’s law generally behaves ideally for concentrations below a critical limit. For most absorbing molecules non-linear behaviour is observed at concentrations above 10mM. However, some absorbing molecules such as methylene blue tend to exhibit deviations from linearity at concentrations as low as 10 µM. Solute – solvent interactions at higher concentrations and even hydrogen bonding are responsible for such deviations..
Chemical factors
Change in pH
Some absorbing molecules undergo change in colour with change in pH of the solvent medium. An example is Phenol red which changes colour from yellow in acidic media to red in basic media due to internal migration of proton accompanied by a switch between a single and an adjacent double bond.
Another example is aqueous solution of potassium dichromate which changes from yellow to orange on increasing the concentration of hydrogen ions due to chromate – dichromate conversion
2CrO₇²⁻ + 2 H⁺ rightleftarrows Cr₂O₇²⁻ +H₂O Chromate Dichromate (Yellow) (Orange)
Complexation , Dissociation or Association
Complex formation due to association can result in colour changes with concentration changes. An example is cobalt chloride which changes colour from green to blue due to association
2CoCl₂ rightleftarrows Co(CoCl₄) (Pink) (Blue)
The degree of association increases with increase in concentration
Instrumental factors
Wavelength selection
Beer- Lambert’s law holds true strictly for single wavelength light. However, due to inefficiencies of monochromator a range of wavelengths gets isolated. In addition stray light also results from internal reflections from optical components such as gratings, lenses and optical windows. Absorption resulting from stray light contributions will show deviations from the Beer- Lambert’s law
Mismatch of solution and cells
Sample and reference blank solutions composition variations or optical mismatch of windows of cuvettes will result in deviations from Beer- Lambert’s law.
To minimize the deviations the following precautions should be taken while reading absorbance of solutions to provide high accuracy of results:
- Always use optically matched pair of measuring cells
- The concentration of analyte should be below the linear range of Beer -Lambert’s plot.
- pH should be maintained at specified value for both blank and sample solutions
- The composition of blank and sample solution should match as closely as possible
What causes deviations from the Beer-Lambert law?
Deviations from the Beer-Lambert law arise from chemical factors, such as pH-dependent color changes or complexation, dissociation, and association reactions, and from instrumental factors, such as stray light and imperfect wavelength selection by the monochromator.
At what concentration does the Beer-Lambert law start to break down?
The Beer-Lambert law generally holds for concentrations below about 10 millimolar for most absorbing molecules, though some compounds, such as methylene blue, can show deviations from linearity at concentrations as low as 10 micromolar.
How can pH cause deviations from the Beer-Lambert law?
Some absorbing compounds change color with pH because of structural changes such as proton migration or shifts between single and double bonds; for example, phenol red changes from yellow in acidic media to red in basic media, which alters its measured absorbance independent of concentration.
How can stray light cause errors in absorbance measurements?
Stray light, which results from internal reflections off gratings, lenses, and optical windows or from an imperfect monochromator isolating a narrow wavelength range, adds to the measured absorbance signal and causes it to deviate from the true, single-wavelength value predicted by the Beer-Lambert law.
What precautions minimize deviations from the Beer-Lambert law?
Deviations can be minimized by using an optically matched pair of measuring cells, keeping the analyte concentration within the plot's linear range, maintaining the same pH for both blank and sample solutions, and matching the composition of the blank and sample solutions as closely as possible.